
Getting the Most from Lantica's Sesame Database Manager

Getting the Most from Lantica's Sesame Database Manager |
|
| . . . . . . . . . . . . . . . . . . . . . . . . . . . . . . . . . . . . . . . . . . . . . . . . . . . . . . . . . . . July 26, 2024 8:59 pm. PST | |
Crosstab Reports for Sesame Databases
Sesame supports columnar and freeform type reports only. The Crosstabber adds real crosstab reports to your databases. If you used crosstab reports in Q&A, output from The Crosstabber will give you comparable results. You can specify Totals, Counts, Averages or a combination of these to get the kind of cross-tabulation you're after. What exactly is a
Crosstab report? How many databases or forms can
have Crosstab reports? How much data can
a Crosstabber report handle?
Can you
add a Crosstab report to my database? |
|
|
|
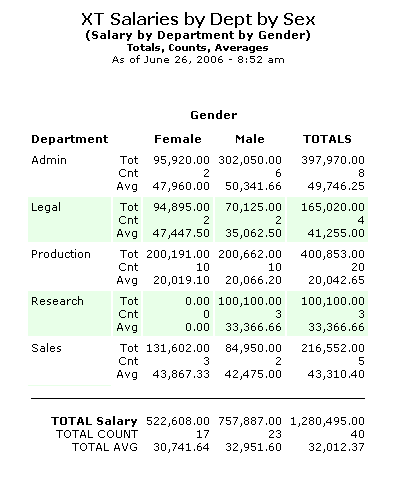
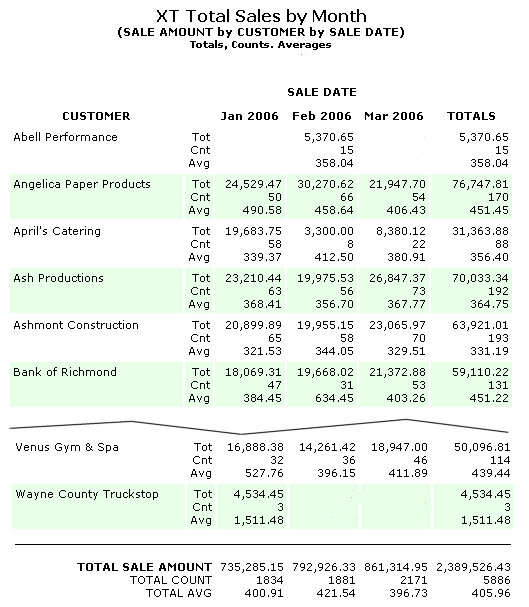
Sample Crosstab Reports A crosstab report is a summary or totals-only report — an analytical report that shows relationships, trends or performance in a compact at-a-glance format that a regular columnar or freeform report simply cannot achieve. RIGHT: This report crosstabulates salaries by department and gender. At a glance, it shows the number of male and female employees in each department, along with the total salaries and average salary. Here, Gender is the COLUMN field, Department is the ROW field, and Salary is the SUMMARY field. BELOW: The report shown below crosstabulates sales by customer and year/month. In this crosstab, Sale Date is the COLUMN field, Customer is the ROW field, and Sale Amount is the SUMMARY field. This crosstab features a custom column format that groups the sales by year/month. Both reports show the kind of output that The Crosstabber actually generates in Sesame. |
 |
 |
|